
Let’s say you’ve got a query, and the point of that query is to take your largest customer/user/whatever and compare their activity to smaller whatevers. If SQL Server doesn’t balance that work evenly across multiple threads, you can experience the CXCONSUMER and/or CXPACKET wait types.
To show how SQL Server ends up waiting, let’s write a query that compares Jon Skeet to 1000 users with the lowest activity. To make this easier, I’m not going to go through with the comparison, I’m just going to set up the aggregations we’d need to do that.
I’m going to do this on the smaller 10GB version of the Stack Overflow database. I need a few indexes first:
|
1 2 3 4 |
CREATE INDEX ix_users ON dbo.Users(Id, Reputation, CreationDate DESC) INCLUDE (DisplayName); CREATE INDEX ix_comments ON dbo.Comments(UserId) INCLUDE (Score); CREATE INDEX ix_posts ON dbo.Posts(OwnerUserId) INCLUDE (Score); CREATE INDEX ix_badges ON dbo.Badges (UserId); |
MAXDOP is set to four, and CTFP is set to 50. Now for the query:
|
1 2 3 4 5 6 7 8 9 10 11 12 13 14 15 16 17 18 19 20 21 22 23 24 25 26 27 |
WITH hi_lo AS ( SELECT TOP 1 u.Id, u.DisplayName, 1 AS sort_order FROM dbo.Users AS u ORDER BY u.Reputation DESC UNION ALL SELECT TOP 1000 u.Id, u.DisplayName, 2 AS sort_order FROM dbo.Users AS u WHERE EXISTS (SELECT 1/0 FROM dbo.Posts AS p WHERE u.Id = p.OwnerUserId AND p.Score > 0) AND u.Reputation > 1 ORDER BY u.Reputation ASC, u.CreationDate DESC ) SELECT u.DisplayName, SUM(CONVERT(BIGINT, p.Score)) AS PostScore, SUM(CONVERT(BIGINT, c.Score)) AS CommentScore, COUNT_BIG(b.Id) AS BadgeCount FROM hi_lo AS u JOIN dbo.Posts AS p ON p.OwnerUserId = u.Id JOIN dbo.Comments AS c ON c.UserId = u.Id JOIN dbo.Badges AS b ON b.UserId = u.Id GROUP BY u.DisplayName, sort_order ORDER BY u.sort_order |
This Query Goes Parallel, Gets CXCONSUMER Waits
This query hits a dead end really quickly. If I sample wait stats with sp_BlitzFirst, they tell an interesting story:
|
1 |
EXEC dbo.sp_BlitzFirst @Seconds = 30, @ExpertMode = 1; |
At the query level (yes, that’s 26 minutes in), we’ve been waiting on CXCONSUMER nearly the whole time.

The wait stats generated for a 30 second window are no less appealing. Nine total waits, each lasting 136 SECONDS on average.

In this sample there are absolutely no waits whatsoever on CXPACKET.
They are nonexistent.
If you were hoping to find out that they were way crazy out of control call a priest and ditch your bar tab we’re driving on the train tracks, you’ll be awfully disappointed.
There just aren’t any.
There’s only one core in use for nearly the entire duration, aside from some blips.

Here’s the plan for it, so far. This is only an estimated plan.
Can I Fix CXCONSUMER Waits with MAXDOP 1?
Yes, but in most cases, my query will run slower.
However, in this case, because SQL Server wasn’t balancing the work evenly across multiple threads, adding a MAXDOP 1 hint to that query reduces query time to about 55 seconds.
It’s also possible to get faster queries by supplying join hints, though not faster than limiting DOP to 1.
The wait stats for it are pretty boring. Some SOS_SCHEDULER_YIELD, some MEMORY_ALLOCATION_EXT.
Stuff you’d expect, for amounts of time you’d expect (lots of very short waits).
CXCONSUMER Wait Types Don’t Mean You Should Set MAXDOP to 1.
This isn’t a call to set MAXDOP to 1, or tell you that parallelism is bad.
Most of the time, I feel the opposite way. I think it’s a wonderful thing.
However, not every plan benefits from parallelism. Parallel plans can suffer from skewed row distribution, exchange spills, and certain spooling operators.
Today, it’s hard to track stuff like this down without capturing the actual plan or specifically monitoring for it. This information isn’t available in cached plans.
This also isn’t something that’s getting corrected automatically by any of SQL Server’s cool new robots. This requires a person to do all the legwork on.
One other way is to use sp_BlitzFirst/sp_BlitzWho to look at wait stats. If you see queries running that are spending long periods of time waiting on CXCONSUMER, you just might have a thread skew issue.
If you blindly follow random internet advice to ignore this wait, you might be missing a pretty big performance problem.
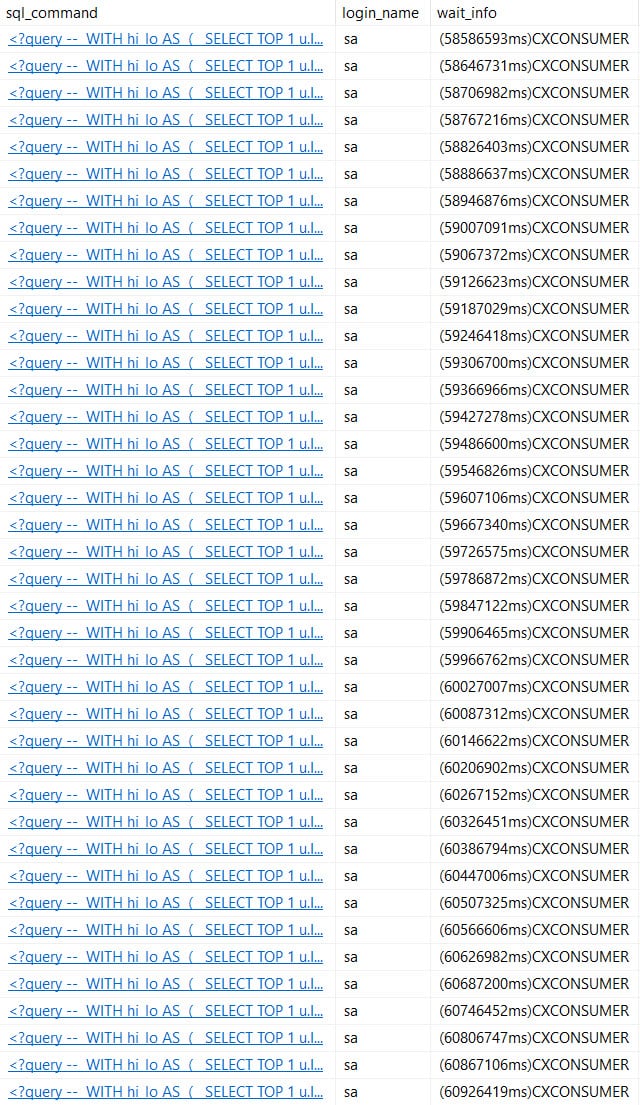
In Updating
This query is now about 17 hours into running. Through the magic of live query plans, I can see that it’s stuck in one particular nut:

I got paranoid about missing cumulative wait stats, so I started logging sp_WhoIsActive to a table.
Here’s what that looks like, for the most recent rows.
Right now it’s July 20th. This post is scheduled to go live on the 24th.
Will it finish before then?!
In Updating More
This query ran for a over 45 hours.

Somewhat laughably, the wait stats for this query show up like this:
|
1 2 3 4 5 6 |
<WaitStats> <Wait WaitType="PAGEIOLATCH_SH" WaitTimeMs="1" WaitCount="15" /> <Wait WaitType="RESERVED_MEMORY_ALLOCATION_EXT" WaitTimeMs="1" WaitCount="2919" /> <Wait WaitType="CXPACKET" WaitTimeMs="304" WaitCount="44" /> <Wait WaitType="SOS_SCHEDULER_YIELD" WaitTimeMs="33575" WaitCount="41044718" /> </WaitStats> |
The CPU time for it looks like this:
|
1 |
<QueryTimeStats CpuTime="164336421" ElapsedTime="164337994" /> |
And the last few minutes of CXCONSUMER waits look like this:
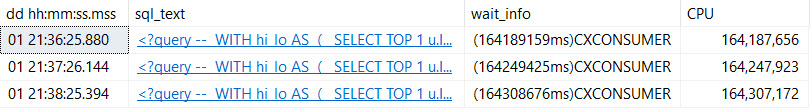
I missed the last 30 seconds or so of the query running, which is why the CXCONSUMER waits here don’t quite line up with the total query CPU time, but they’re very close. Why doesn’t that wait show up in the query plan? I have no idea.
What really gummed things up was the final Nested Loops Join to Posts.
That’s a 13 digit number of rows for a database that doesn’t even have 50 million total rows in it.

Bottom Line: Don’t go ignoring those CXCONSUMER waits just yet.
Thanks for reading!
What To Learn Next
- How to Do a Performance Health Check
- How to Measure Your Server’s Top Wait Types with sp_BlitzFirst
- How to Fix CXCONSUMER and CXPACKET (from our Mastering Server Tuning class)

7 Comments. Leave new
I have run into this several times recently on SQL Server 2017 Enterprise. It’s highly annoying, and it’s certainly not a “harmless” wait stat. Has anyone come across a good method of troubleshooting for the solution? Our solution was re-engineer the entire query from the ground up. It seems to have fixed it, but it’s a lot of work, and we still don’t know what the cause of the query wait was. And yes, I looked at the plan, and it didn’t tell me anything concrete.
Jon – by troubleshooting, what do you mean? It comes down to monitoring wait stats at this point, unfortunately.
I agree that deeming it harmless was premature. If you have a specific scenario, leave a comment here.
Thanks,
Erik
Not really on a subject, but: I remember when CXCONSUMER wait type was announced to be added, many people believed (including me) that it will be used just to recognize control thread (ID = 0) and make CXPACKET waits more meaningful. Unfortunately, control thread can register CXCONSUMER or CXPACKET so I think there is still no 100% sure method to exclude control thread waits. Or am I wrong?
Piotr — yeah, I’m not exactly sure what to make of it anymore. It seems like something I’d keep an eye on.
[…] hitting more of those harmless, silly little CXCONSUMER […]
I ran into this CXCONSUMER wait type today. Things I found:
1. Queries suddenly reverting to a full table scan / using a bad index to seek for data
2. Distributed transactions managed by MSDTC timing out.
Took me about 2 hours to figure out the MSDTC timing out was a red herring and caused by the large IO reads (page reads per second, page writes per second stats shot through the roof), which in turn caused buffer cache hit ratio to drop, which in turn caused page life expectancy to plummet 75%. I found the offending queries with the table scans and started work on a fix.
[…] https://www.brentozar.com/archive/2018/07/cxconsumer-is-harmless-not-so-fast-tiger/ (useful) […]